
Click here to see full-resolution version.
Above figure is a static image of the interactive dashboard prepared for September 2011 Quality of Air Summaries in Baltimore forecasting region. This static version includes annotations under the bottom-left graph whereas the interactive version (shown below under INTERACTIVE VISUALIZATION section) does not. This simple technique can be used to highlight or clarify data in the graph. Details will follow in the DISCUSSION OF VISUALS AND ANALYSIS TECHNIQUE section.
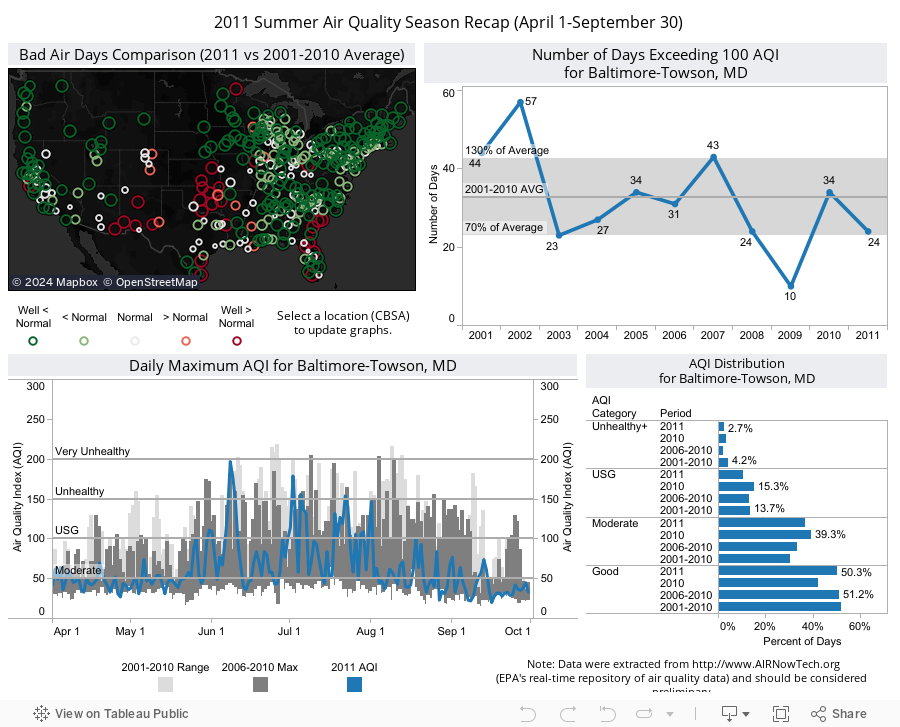
Above figure is a static image of the interactive dashboard prepared for September 2011 Quality of Air Summaries in Baltimore forecasting region. This static version includes annotations under the bottom-left graph whereas the interactive version (shown below under INTERACTIVE VISUALIZATION section) does not. This simple technique can be used to highlight or clarify data in the graph. Details will follow in the DISCUSSION OF VISUALS AND ANALYSIS TECHNIQUE section.
Top-left: Map showing number of bad air days comparisons for 2011 vs 2001-2010 average.
Top-right: Time-series showing number of bad air days during the summer air quality season for selected CBSA from 2001-2011. Gray shaded area show the typical number of bad air days.
Bottom-left: Time-series of daily peak AQI for selected CBSA in 2011 (blue line). Historical AQI are shown as bar charts.
Bottom-right: A sorted bar graph showing air quality distribution by AQI category and year for selected CBSA.
THE STORY
Source: Maryland Department of the Environment's Quality of Air Summaries. (It is copied and pasted directly here.)
Meteorologically and air quality-wise, this summer comprised many interesting highlights. Meteorological highlights will be mentioned with appropriate web resources for further reading. The above dashboard only provides a quick summary of air quality across the U.S. The top map shows a quick comparison of bad air days in 2011 to the 10-year average (2001-2011). By selecting a Core Based Statistical Area (CBSA, e.g. Baltimore-Towson, MD CBSA being selected), other AQI statistics will be updated to provide an instant snapshot of the air quality conditions in that area. Although the discussion is focused on the Mid-Atlantic, a national overview of the data provides additional context. In addition, refer to archived summaries for selected event analyses as well as supporting information for the seasonal recap. The season began with a warmer and wetter than normal weather pattern in much of the Mid-Atlantic (see NCDC precipitation & temperature maps). These weather conditions were somewhat typical in the region for a La Niña Spring and were not conducive for ozone formation as well as particle pollution accumulation, and resulted in one of the lowest recorded AQI during April and May in many areas in the Mid-Atlantic. By Memorial Day, a broad area of high pressure system built and persisted across much of the eastern U.S., which allowed hot and humid air to be transported northward into the Mid-Atlantic. This high pressure resulted in the first heat wave of 2011 for the region and caused an extended air quality event (May 30th-Jun 2nd). The 2nd heat wave impacted the Mid-Atlantic and Northeast shortly after the first and resulted in another extended air quality event (Jun 7th-10th). This episode also included the highest daily AQI for Maryland since 2001. Fast forward to July, the Mid- Atlantic and Northeast (and other parts of the Country) continued to observe record breaking temperatures and very dry conditions (below normal precipitation). These conditions lead to a very active month for ground-level ozone in the Mid-Atlantic. From a public health perspective, it was troublesome but from a research perspective it was somewhat “appreciated.” During July, an extensive NASA field study called DISCOVER-AQ took place over Maryland. For the first time, an integrated data set of airborne and surface observations were taken and will be made available to researchers and scientists for analytical studies. Results from these studies will (no doubt) advance the frontier of air quality science for years to come. Once August arrived, the weather pattern changed drastically. Weather patterns transformed from persistent heat to record rainfall/flooding in the Mid-Atlantic and Northeast. Aside from the abundant rainfall and flooding, other highlights included frequent rainy days, a hurricane (Irene in August) and a tropical storm (Lee in September). These weather conditions were the primary reason behind one of the lowest AQI periods ever experienced in many areas in the Mid-Atlantic. A large wildfire called in the Great Dismal Swamp National Wildlife Refuge called Lateral West Fire started on August 4th and fully contained around September 30th. Its impact on air quality in Maryland couldn’t be measured due to lack of PM2.5 monitors in the Eastern Shore (where the impact was thought to be the greatest). Last but not least, a non-air quality related event to remember was a magnitude 5.8 earthquake that shook the East on August 23rd. Amongst the season highlights, it is important to note that air quality in Maryland and much of the eastern U.S. was better than a typical summer using a 10-year average as a comparison (see top-right and bottom-right graphs). The AQI time-series on the bottom-left also provides a daily comparison between 2011 vs historical 5- year and 10-year data. This time-series confirms and provides a visual inspection of the AQI trend, which once again showed mostly improving air quality conditions.
INTERACTIVE VISUALIZATION
Use the interactive dashboard below to explore the data and come up with a story in your area. Reload the page if it appears to be blank.
DISCUSSION OF VISUALS AND ANALYSIS TECHNIQUE
Imagine you are a concerned or curious citizen who really wants to learn more about the air quality conditions where you live, what questions you would ask? A few possible questions are highlighted below:
- Q1: What was the overall air quality in my region and how does it compare to other areas?
- Q2: How many bad air days were observed and how did that compared to previous year?
- Q3: What is the air quality trend?
- Q4: What were some of the highlights for the season?
Before diving deep into the discussion of visuals, I want to acknowledge that 2001-2011 data across the U.S. were extracted from http://www.airnowtech.org/, EPA's real-time repository of air quality data and should be considered preliminary. In addition, I define April 1-September 30 to be the summer air quality season. This is true for the Mid-Atlantic but it would be different in other areas. Lastly, it's important to note that raw data (non-aggregated) should be extracted from AIRNowTech and then processed manually to ensure consistent statistics. To the best of my knowledge (and I could be wrong), old sites in this system were likely not assigned to a CBSA. Thus, extracting data by CBSA may yield in-consistent statistics over time. For data analysts who follow this blog, you can mash raw AIRNowTech data to a text listing of CBSA on the U.S. Census Bureau by merging FIPS code (combination of 2-digit state code and 3-digit county code) to the first 5 digits of site ID / AQS Code.
Going back to the discussion of visuals, the map on the top-left panel of the dashboard provided an overview air quality across the United States. In this map, the number of bad air days (days exceeding 100 AQI) in 2011 was compared to the 10-year average (2001-2010) to get a sense of "normal." Most importantly, the qualitative state (normal, below and above normal) for each area presented on the map was explicitly declared. This technique was also used in first post of the blog (July 2011 Record Heat and Its Impact on Air Quality). For visitors who had not read the first post on the blog, the technique is elaborated below:
- Defined 2001-2011 average as “normal” and computed percent change between 2011 vs 2001-2010 (i.e. departure from normal).
- Defined the qualitative state of 2011. I defined normal as percent change within ± 30% of normal; Incremental values between 30-60% above/below 10-year average would be considered "above/below normal." Likewise, values below -60% and above 60% would be considered "well below normal" and "well above normal", respectively.
The next visual shown in the bottom-right (i.e. AQI distribution chart) would help answer the first 3 questions in their entirety. Traditionally, this type of data is presented using pie chart. However, it is less effective for communicating quantitative information by making it harder for readers to decode information as compared to a bar chart. Refer to Stephen Few’s Visual Business Intelligence Newsletter titled “Save the Pies for Dessert” for further reading. I must confess, I am a convert myself. Below are fictitious AQI data presented as a pie chart for demonstration.

- Let's try to determine which color represents the largest slice? Green, Yellow or Orange? Is it hard to accomplish such a simple task? Even if you think know the answer, you are not 100% confident. This is exactly what should be avoided when it comes to designing visual to communicate data.
- Now, let's mouse-over the pie chart to see their labels. Notice that we are now relying on the labels or essentially an equivalent of a data table to determine their values. If you got it right, give yourself a tap on the back. For the rest of us (including me), we have to recognize our limitation to judge angle in this type of display.

Some of us may be thinking about the use of a time-series to present these data. However, it is not logical to create a time-series graph since the periods are not the same. Edward Tufte introduces Slopegraphs as a way to compare changes over time and it could be applied to the AQI distribution data. However, if we choose to use this type of display, we must modify the periods a bit to make it presentable for a slopegraph. For instance, we could use three periods: 2001-2005, 2006-2010 and 2011. A slopegraph for Maryland data is provided below. By the way, I would have used this display in the dashboard instead of a bar chart if Tableau supports it. However, it does not at the moment. For readers who are interested in creating this graph, you can google "Tufte comparison chart" to find resources on how to create slopegraphs.


Thus far, we have discussed three visuals in the dashboard. The last visual is a time-series graph of daily peak AQI (blue line). Overlaid on the background includes bar charts showing historical 5-year and 10-year maximum AQI. These data along with the daily peak AQI allow us to observe general pattern, outliers as well as trend. This graph may appears overwhelming initially; however, getting used to it can offer much insight into the data. After all, the graph is designed to provide a detailed history of the summer air quality in its entirety. I would consider this graph a "cross-over" between visual designed for analysis vs communication. This leads to the next point that I want to bring up for discussion - Annotation.
Annotation is defined as "a critical or explanatory note or body of notes added to a text" by dictionary.reference.com. Applying this concept to visuals/charts is no different. The act of annotating is not hard since we only have to write text and create special drawings (e.g. circle, lines, etc.) to engage readers and communicate the data more clearly. However, the process of making annotations is difficult because it requires "critical" and "analytical" research about the data as well as a good understanding of the story hidden in the data. I strongly urge all my colleagues in the air quality community to apply this technique in your visuals. My approach to using annotations is simple "if something in the visuals deserve to be highlighted to help readers understand the materials, then it ought to be annotated."

SHORT TAKE-HOME MESSAGE
I hope the demonstrations in this post can play a role in stimulating us to start thinking about designing visuals differently. Remember there are multiple ways of presenting the same information. Knowing the strength as well as weaknesses in each method can help us design more effective visuals for communicating air quality information. If you are interested in showing air quality trend or AQI distribution data (part-to-whole relationships), use a bar chart and/or slopegraph instead of a pie chart. If you are interested in highlighting or clarifying data or information in a graph, use annotations.
What are your thoughts in regards to the visuals? Please participate in the discussion to help promote thoughtful presentation of air quality information. This is a learning process.
DISCLAIMER: Any statements, postings, shares, likes, follows on the blog should be considered personal. They do not represent any political or official endorsement from my employer.
No comments:
Post a Comment